TLDR: Ethereum —> $1 Trillion Market Cap, New BTC Floor @ $55k - $56k (if wrong I delete this post)
ANALYSIS:
Per usual, need to kick things off with the BTCUSD price chart:
The end of last week brought a new close above the 30-day 50% web (blue), the midpoint between the highs and lows over the past month. It also happens to be that the Difficulty Price (white) climbed from $50k to $56k over the weekend as well, bringing a decent confluence of support around the $55k - $56k area. Off this chart alone, I’m looking for Bitcoin to establish a new floor around these levels.
If we revisit $50k it certainly doesn’t look pretty, but there is still decent support down there with the 90-day 50% web (green) and the bottom Adjusted NVT Signal band.
Since we’re not at new highs and not necessarily out of the woods yet, I wanted to build a simple tool to help me gauge the magnitude of profit taking going on right now in Bitcoin:
The calculation for the chart is simple: Change in Realized Cap over the past 3 days divided by the Current Market Cap.
Large Green Values = a lot of profit taking
Large Red Value = a lot of losses being realized
After looking at this chart it’s quite apparent that there’s been heavy profit taking from $40k - $60k, and we’re just started to settle out in terms of returning back to normal levels. One thing I always need to remind myself is that accumulation / distribution isn’t a single point in time, but moreso an extended period of time. It’s pretty clear that we’ve had one of those periods since the start of 2021.
Ethereum has been on a ripper so let’s talk about it:
The chart above shows Ethereum versus its value stored per byte at different levels:
Green: $0.15 stored per byte
Blue: $1 stored per byte
Red: $5 stored per byte
In simple terms, Ethereum makes the trade off of growth at the cost of blockchain bloat. From the user’s perspective you can view this chart as the cost to store data - at higher levels it’s more expensive, and viceversa (HT to Ben Lilly for this perspective). Buying $0.15 has been wealth generative, $1 has been the bull / bear line, and $5 has been the time to take caution. We just broke above $1 convincingly, and possibly on our way to $5 / byte. If that happens, Ethereum is on a warpath to $1 Trillion + Market Cap (at least).
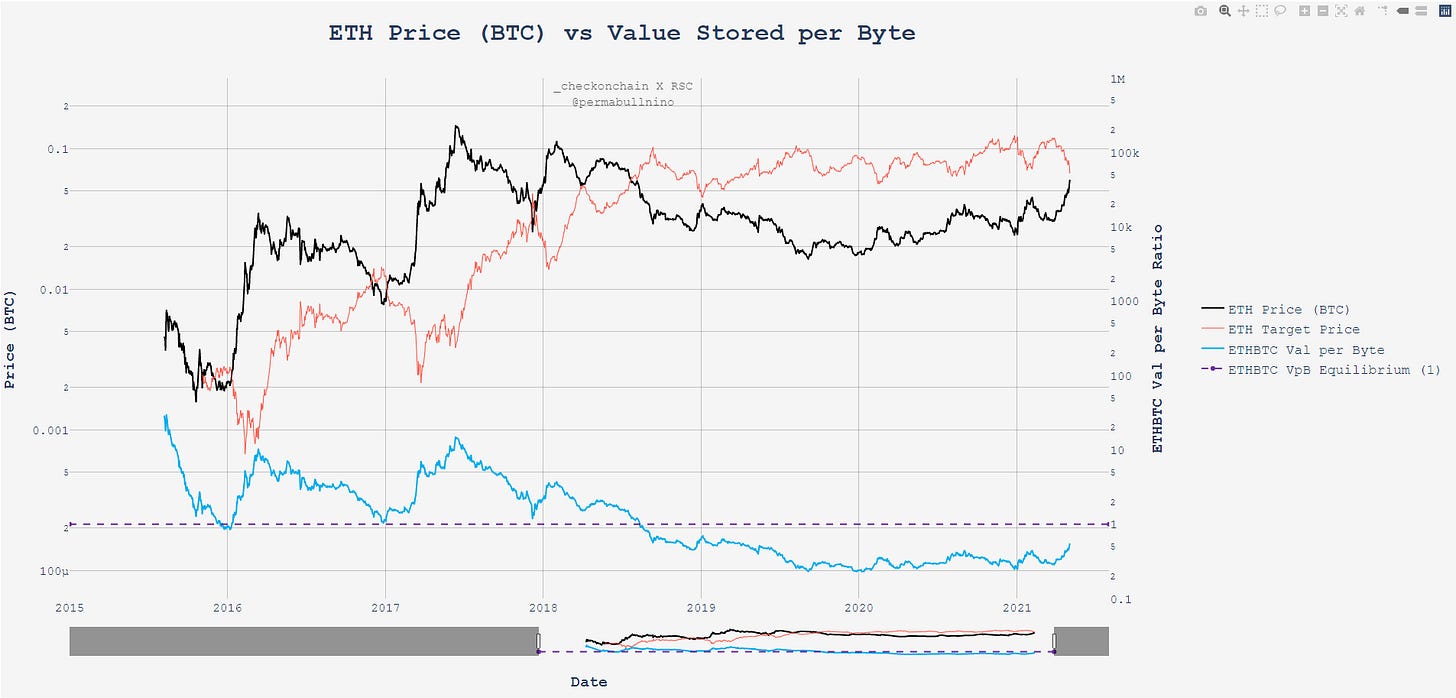
We can compare Ethereum’s value storage to Bitcoin’s, and come up with an implied ETHBTC price for the two of them to reach value storage parity:
Ethereum val per byte value is currently 55% that of Bitcoin’s, which implies ETHBTC price would need to do a 1.8x for the two to reach value storage parity. ETHBTC has a decent track record of oscillating around the implied price over time, so this is something worth monitoring as we move closer to it.
Last Ethereum snapshot:
Yesterday’s 16% ETHUSD pump was accompanied by a ~2x increase in USD on-chain volumes day over day. Bullish.
That’s all. Get after it lads.


