

PB Banter 6-11-2021

All charts are from or will soon be coming to checkonchain.com
ANALYSIS:
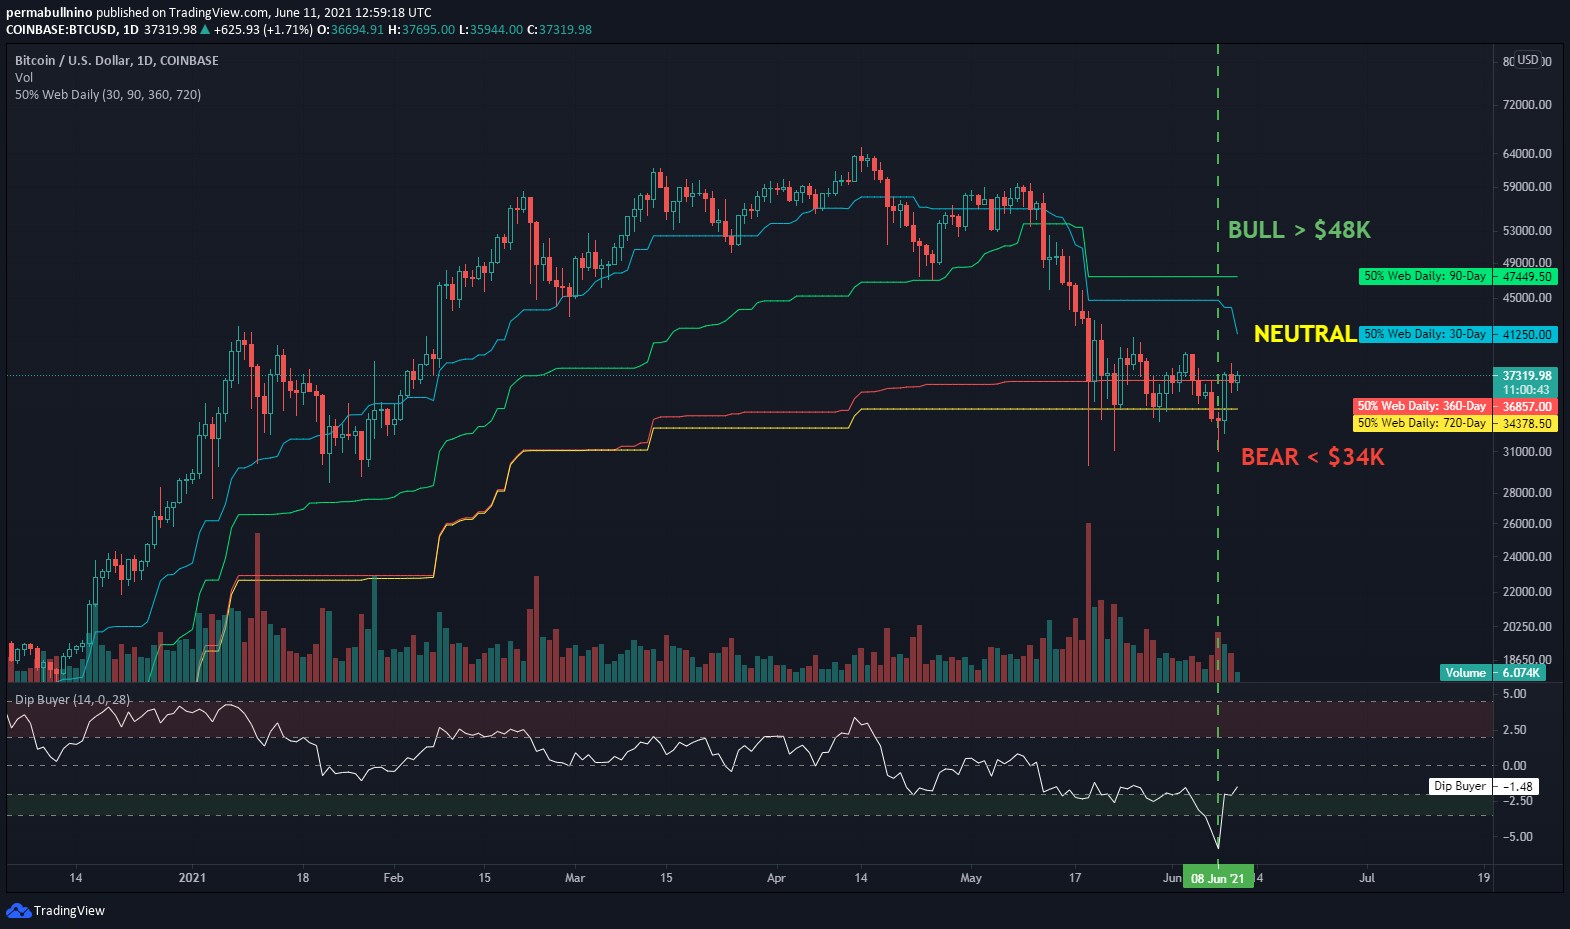
Another day, and another week at the $34k - $40k level. From a technical perspective, same rules apply - bullish on a bounce as long as we hold $34k. After a brief visit below it, we had a very interesting print from one of my favorite mean reversion tools. Vertical line in chart above shows the lowest ever daily print for such tool. Other prints anywhere near this level have marked macro bottoms that resulted in strong bounces.
That’s the technical side, let’s talk sentiment. As expected, tons of flip flopping of emotions and speculation over whether we’re in a bear or bull market. I’ll share a few thoughts on this below.
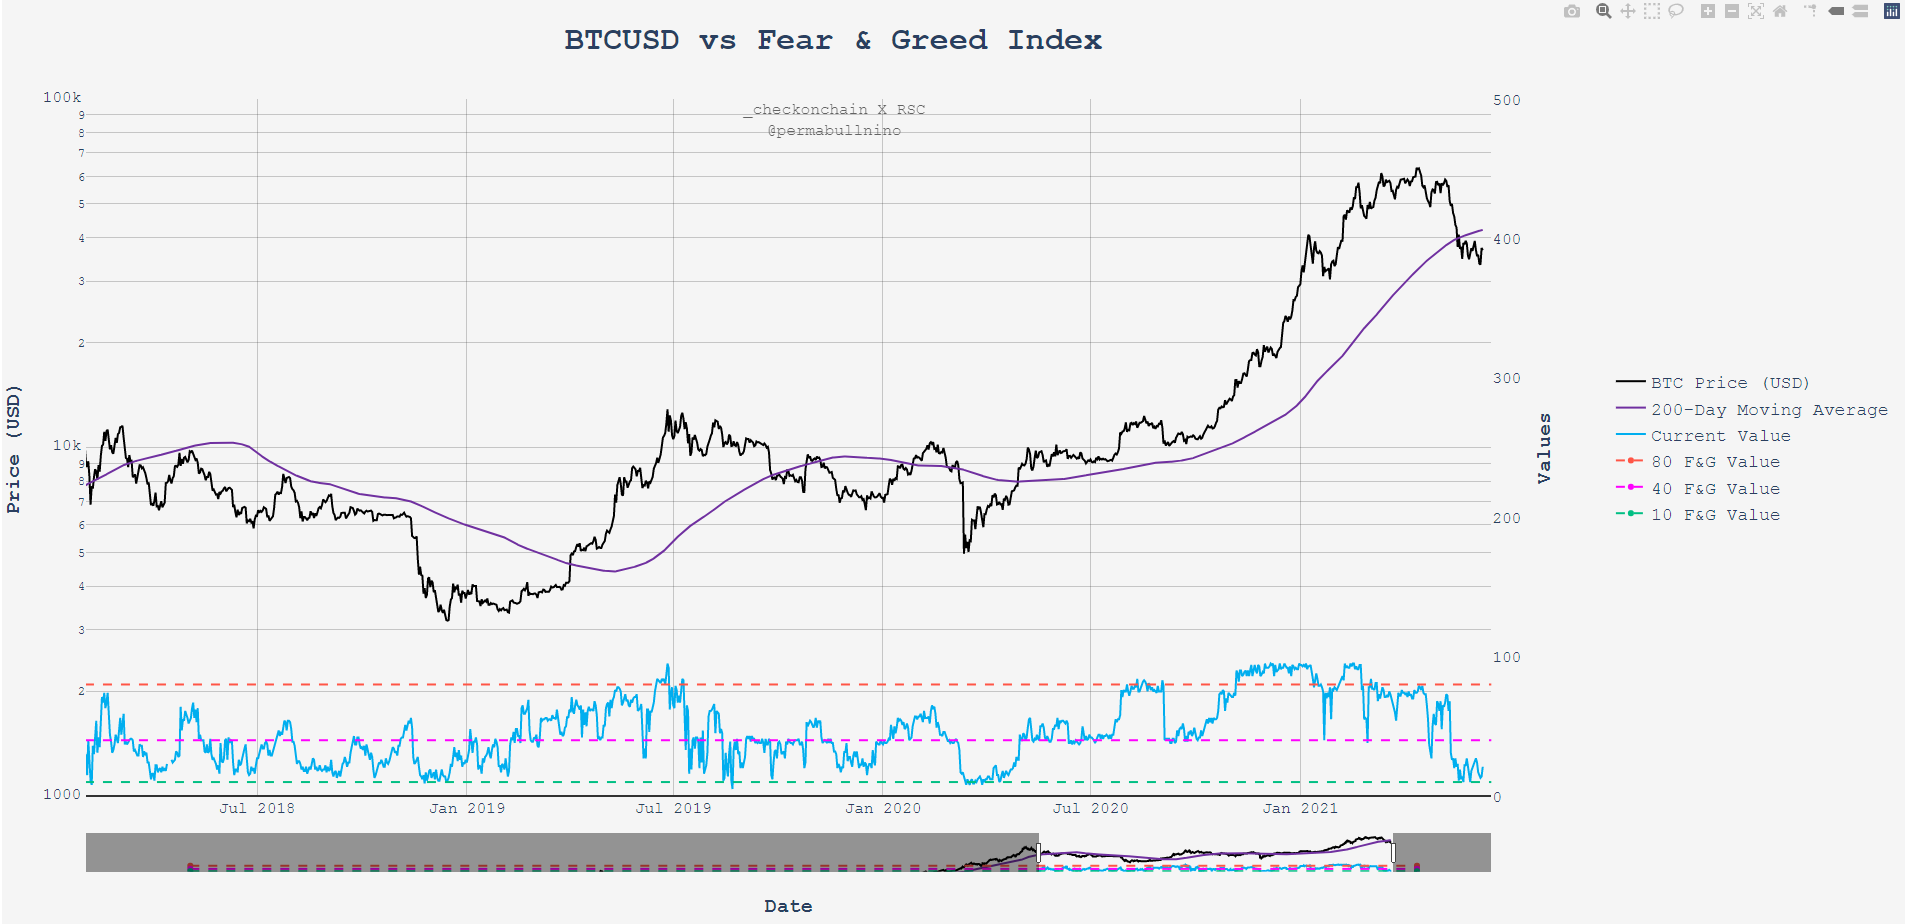
This chart shows BTCUSD vs the Fear & Greed Index. At the beginning of the bull I remember hearing ‘fear and greed index is trash, you would’ve missed the entire run if you sold the high value prints’. Now that price has nuked, I see it being referred to everywhere. Funny how that works.
I’ve spent a decent amount of time looking at this sentiment tool, and here are a few takeaways that might be non-obvious ( for those who don’t use it much at least):
40 is the bull / bear line in the sand for sentiment
The F&G Index works best for counter trend. For example - in bullish market conditions (like we had in early 2019 and late 2020-early 2021) it does an average job at identifying tops, but does an amazing job identifying bottoms with prints of 40.
I’ve seen a lot of people getting excited about the really low prints as of late, but I’ll be honest - these values don’t excite me. Breaks below 40 have preceded trash price action, just see what happened late 2019. I’m not gonna beat a dead horse with this, y’all get it - just my quick take on the tool.
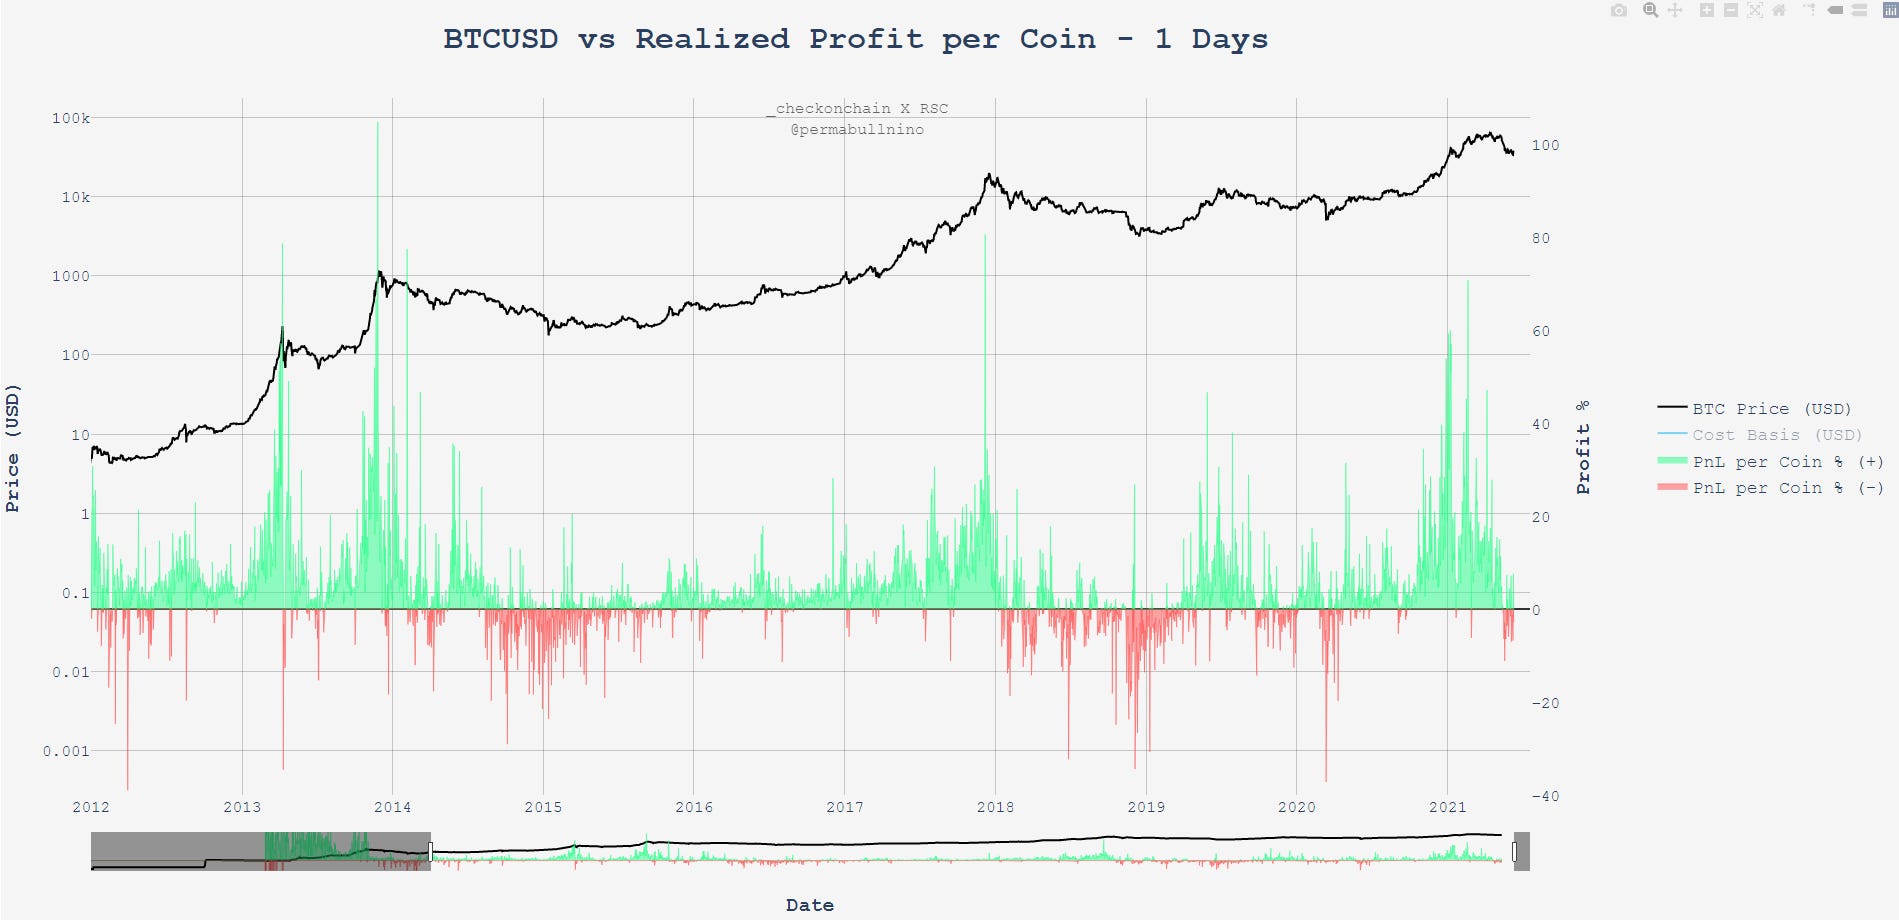
I’m expecting a bounce *at a minimum* from the current levels we’re at, and expect alts to suffer along the way. And then the reaction on the bounce is where my head will be at. This chart shows the average profit % taken per coin moved on any given day. All prints over 60% nailed macro tops almost to the pip. Some people are naturally going to fade the bounce, but I really don’t want to see large prints (50%+). Why? Because that signals people who bought this dip just view it as a deadcat bounce (and believe so with conviction). Not the people I want to be betting against.
Now he’s a rosier chart despite my altcoin near term bearishness:
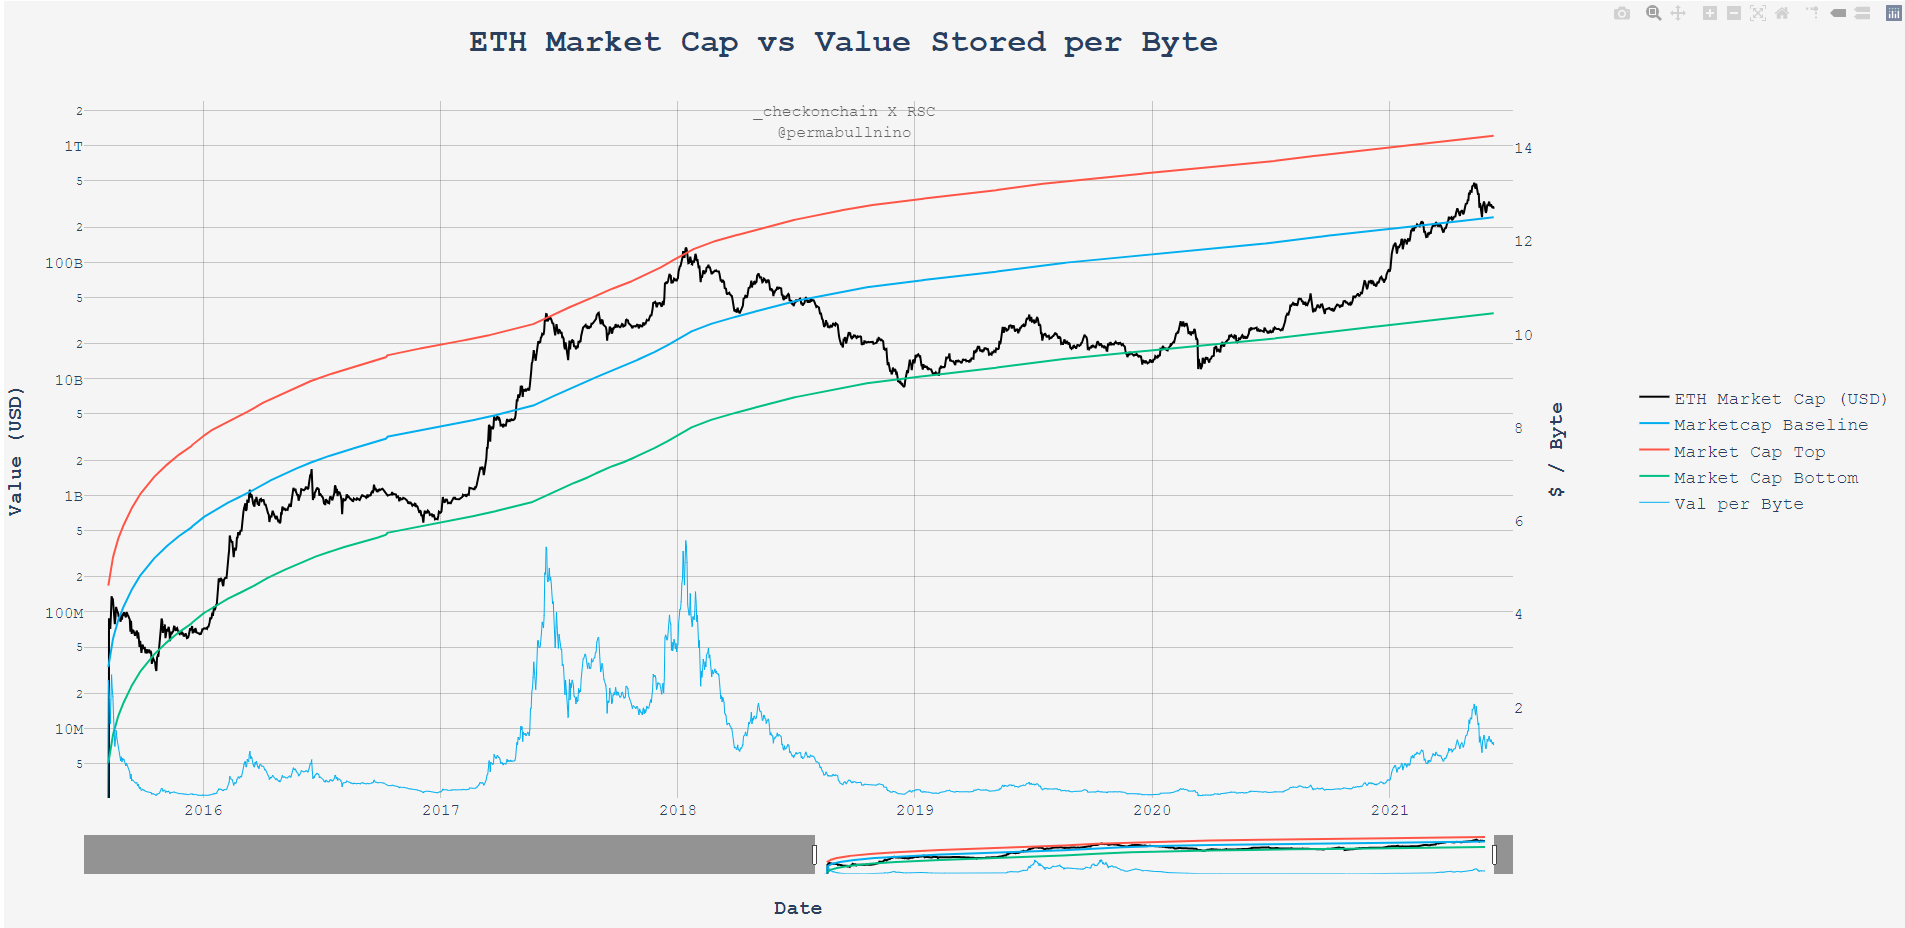
Ethereum held above the historical $1 / byte line, which has historically been a line in the sand for sustained bullish price action. For now this still implies Ethereum to $1 Trillion Market Cap before the cycle is over.
In my opinion ETHBTC was headed higher, but this BTCUSD dump changed the gameplan. There aren’t a ton of BTC profits to rotate into ETH, and I’m not convinced that the cash demand for ETH is greater than BTC for the time being. After all - kind of tough to trump the ‘nation state adoption’ narrative in the near term. Could be wrong of course - a new ETHBTC high and that theory is invalidated.
That’s all for today - now go pump my bags (por favor).
Stay bullish,