

PB Banter 6-4-2021
PB Banter 6-4-2021
"I've realized things are stable"

All charts are from or will soon be coming to checkonchain.com
ANALYSIS:
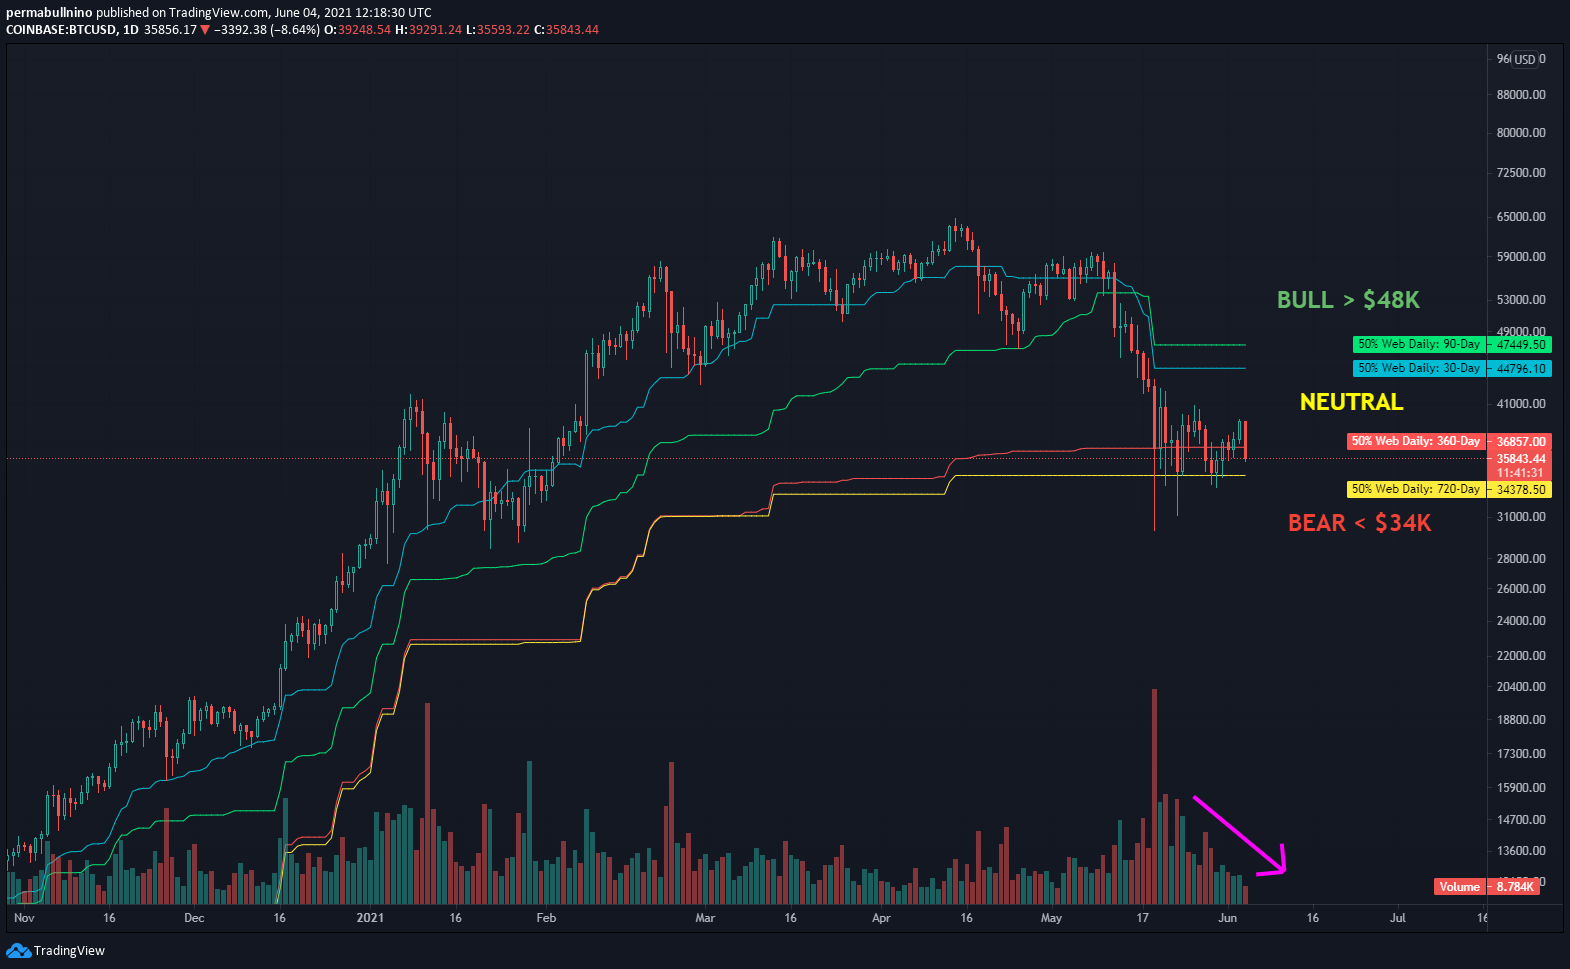
After an extended break, we’re back baby. In this period of time not much has changed for Bitcoin, as price remains in the chop zone between $34k and $40k. Not much to do until we get an impulse north or south.
With this in mind, I’ve been taking some time to reflect on new ways to gauge supply and demand dynamics within the crypto markets. For today’s post I’m going to focus on comparisons between (1) changes in Realized Cap and (2) Stablecoin Prints.
The rationale for each is simple:
Realized Cap = Supply * Price Coins Were Last Moved. This means when old coins move in size, it causes large spikes upwards in Realized Cap (because Bitcoin basically goes ‘up only’ over the long arc of time) as these old coins get repriced to current levels. In bear markets you will see large spikes downwards in Realized Cap, as top buyers with deep pockets head for the exits (and coins get repriced to lower levels). For these reasons, changes in Realized Cap are insanely high signal - they take coin age, PnL of coins, and volume of coin movement into account.
Stablecoin Prints: Although new stablecoins don’t necessarily go directly into buying Bitcoin, they’re more chips entering the crypto casino. Simple as that.
In the charts below we have the BTCUSD prices (top half) and the overlay of Realized Cap changes vs Stablecoin Prints (bottom half, and on a rolling 7-day basis). I took the absolute value of the 7-day changes in Realized Cap for purposes of this exercise, because I don’t particularly care about whether the coin movers were in profit or realizing losses - I’m more concerned with the magnitude of the print because it *implies* a certain amount of selling is taking place.
The 3 charts (in order) are:
March 2020 (Covid Dump)
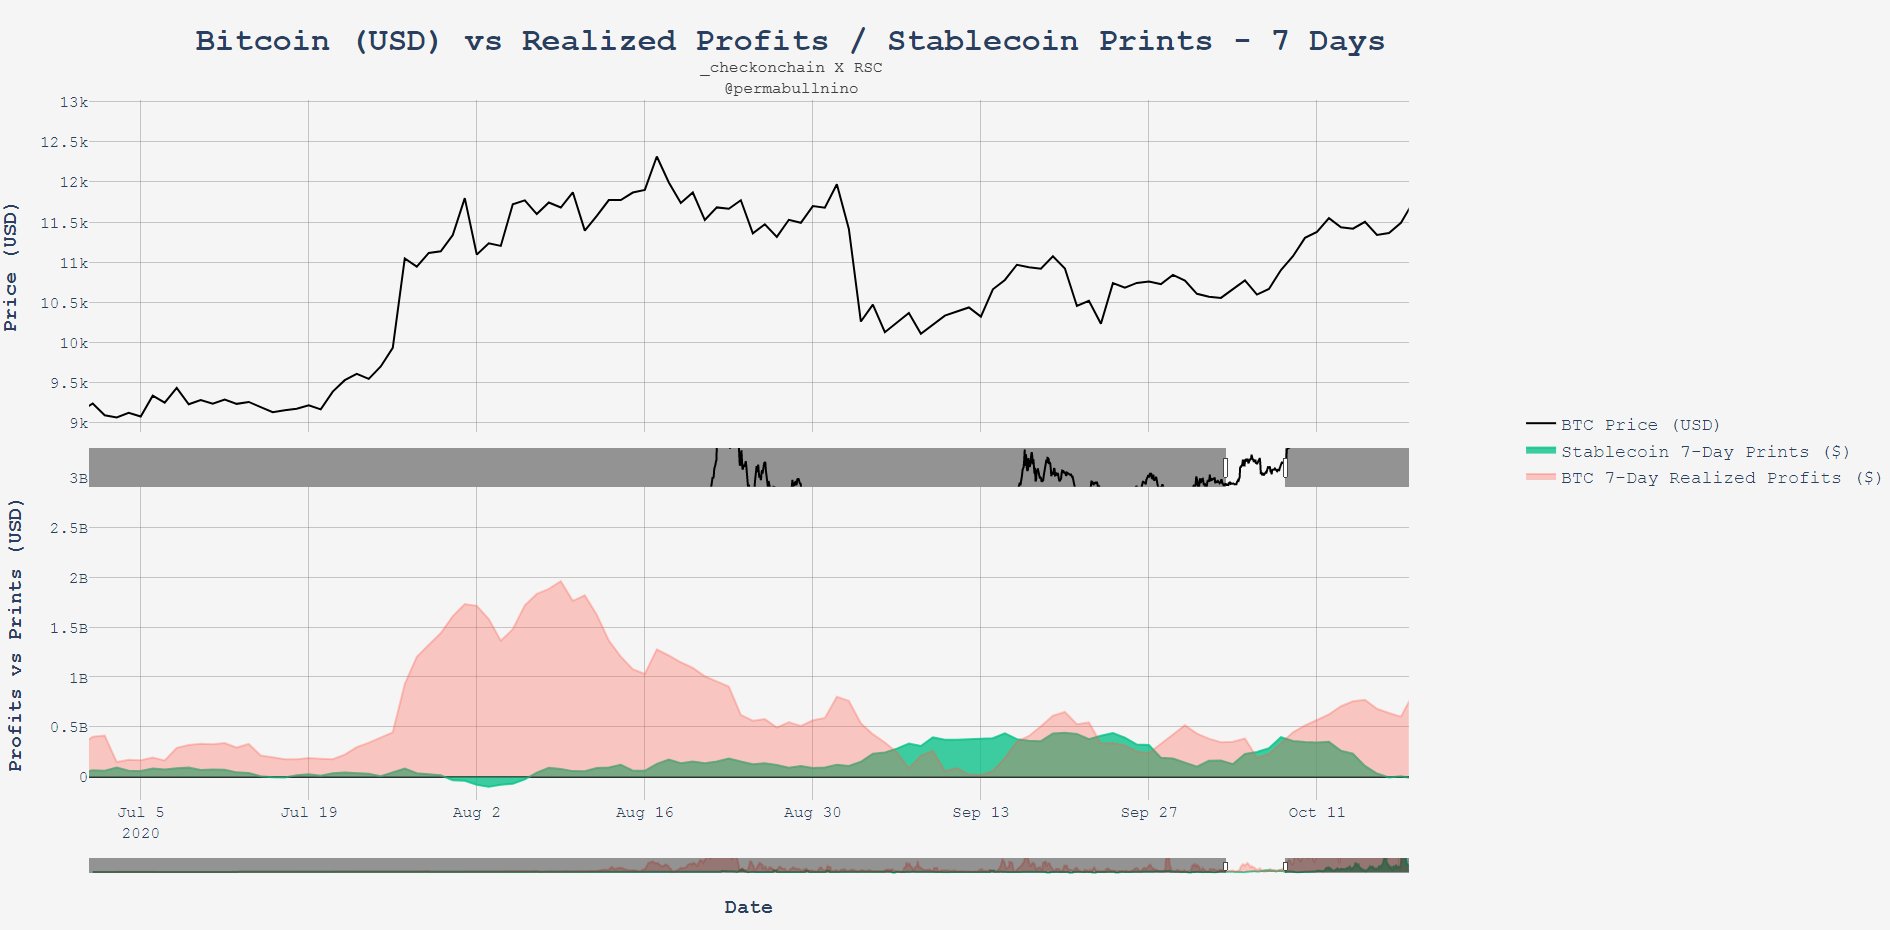
September 2020 (Saylor enters the picture)
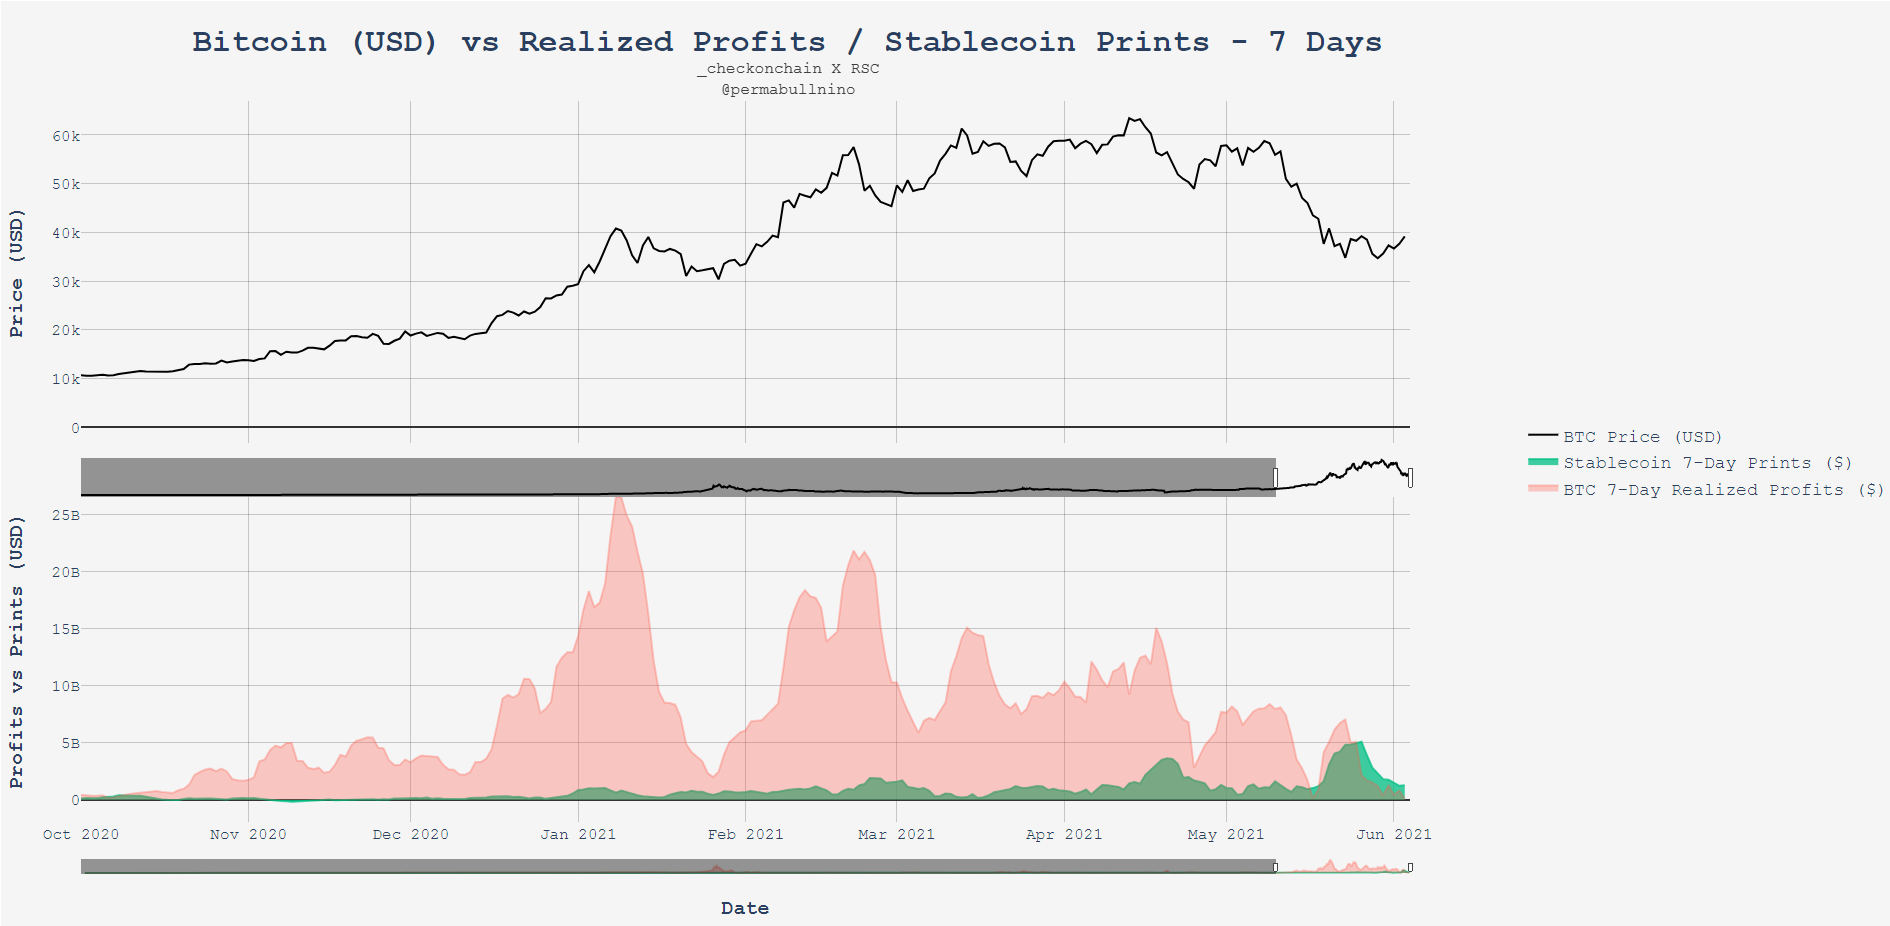
Now
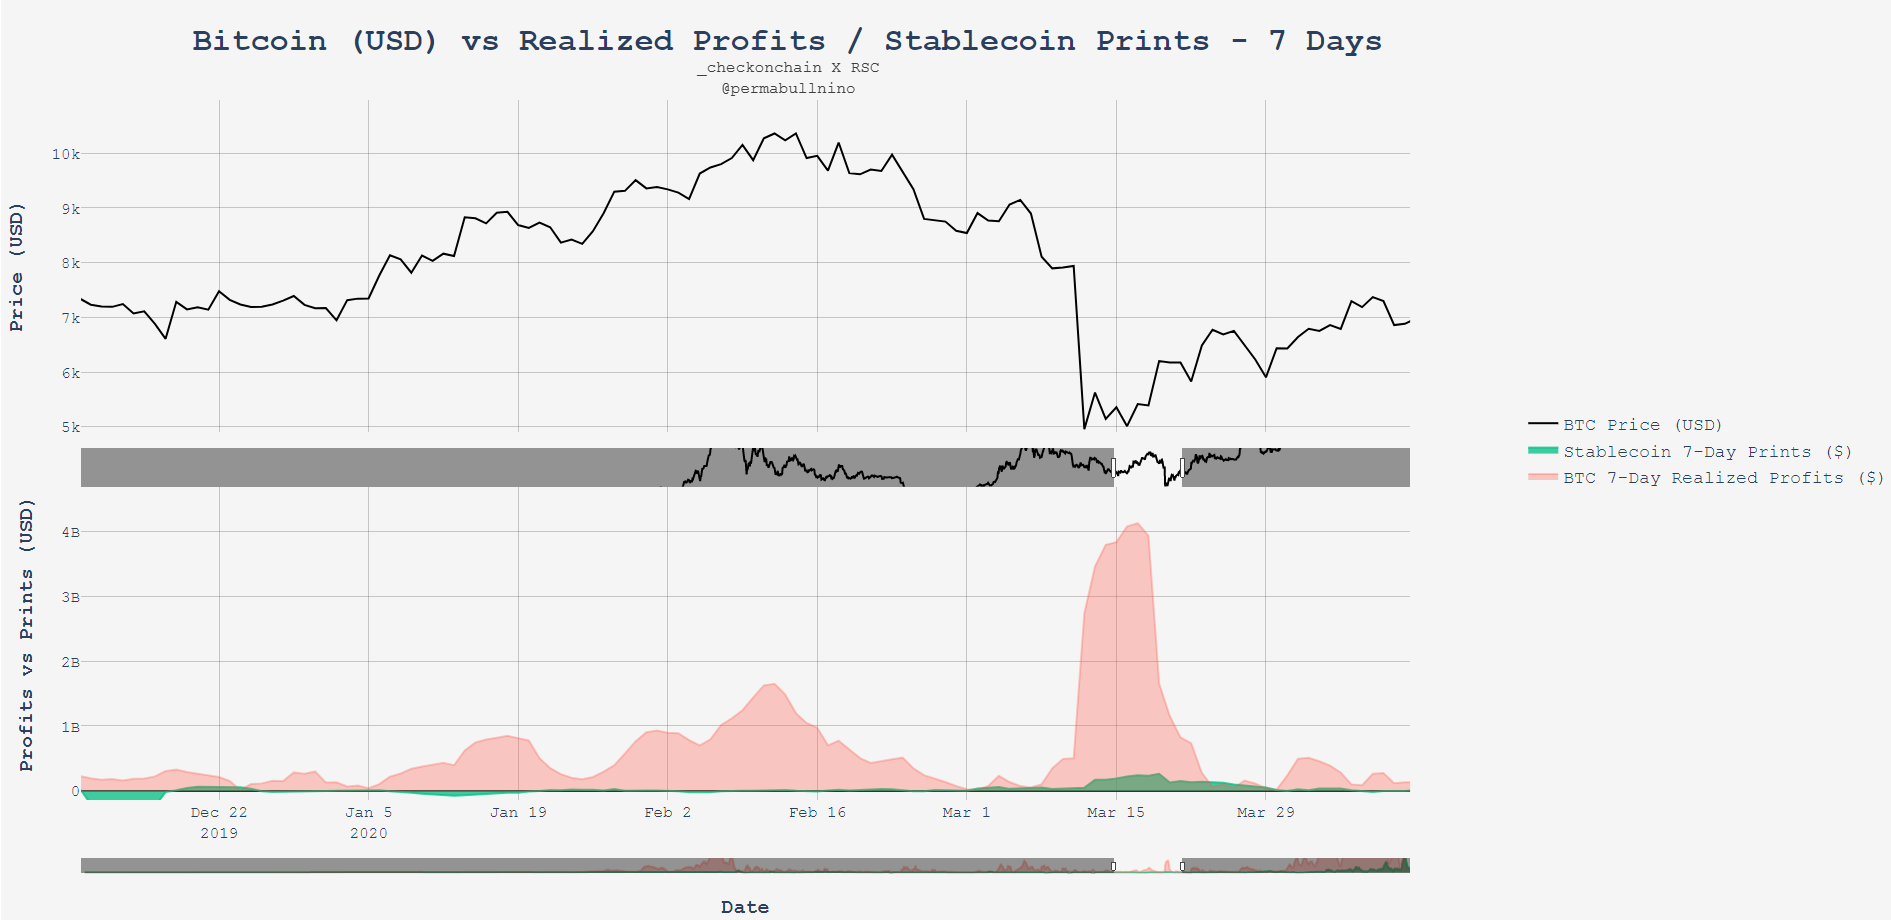
I’ve included these charts because they’re the only times since the beginning of this bull market that stablecoin prints have eclipsed realized profits / losses. When you think about it, it makes sense: in order to put in bottoms you need minimal supply side pressure with very small Realized PnL prints, and obviously you need buyers in some capacity to push the price north.
It remains to be seen if we’ve actually put in a bottom, there’s no guarantee of that until price action settles in one direction or the other. Secondly, this is a new study so we’re gonna need to see more data over time to validate this theory. But just as I am explaining this to the reader, I’m also digesting the data myself. I think it makes sense, what do you think?
Stay bullish,