

PB Banter 7-9-2021

All charts are from or will soon be coming to checkonchain.com
If you’ve been following some of my musings on Twitter, you’ll see that I’ve been locking in on the Coinbase IPO, the price action that followed, and how it potentially paints a roadmap for the crypto markets moving forward.
The rationale behind my short term obsession is this:
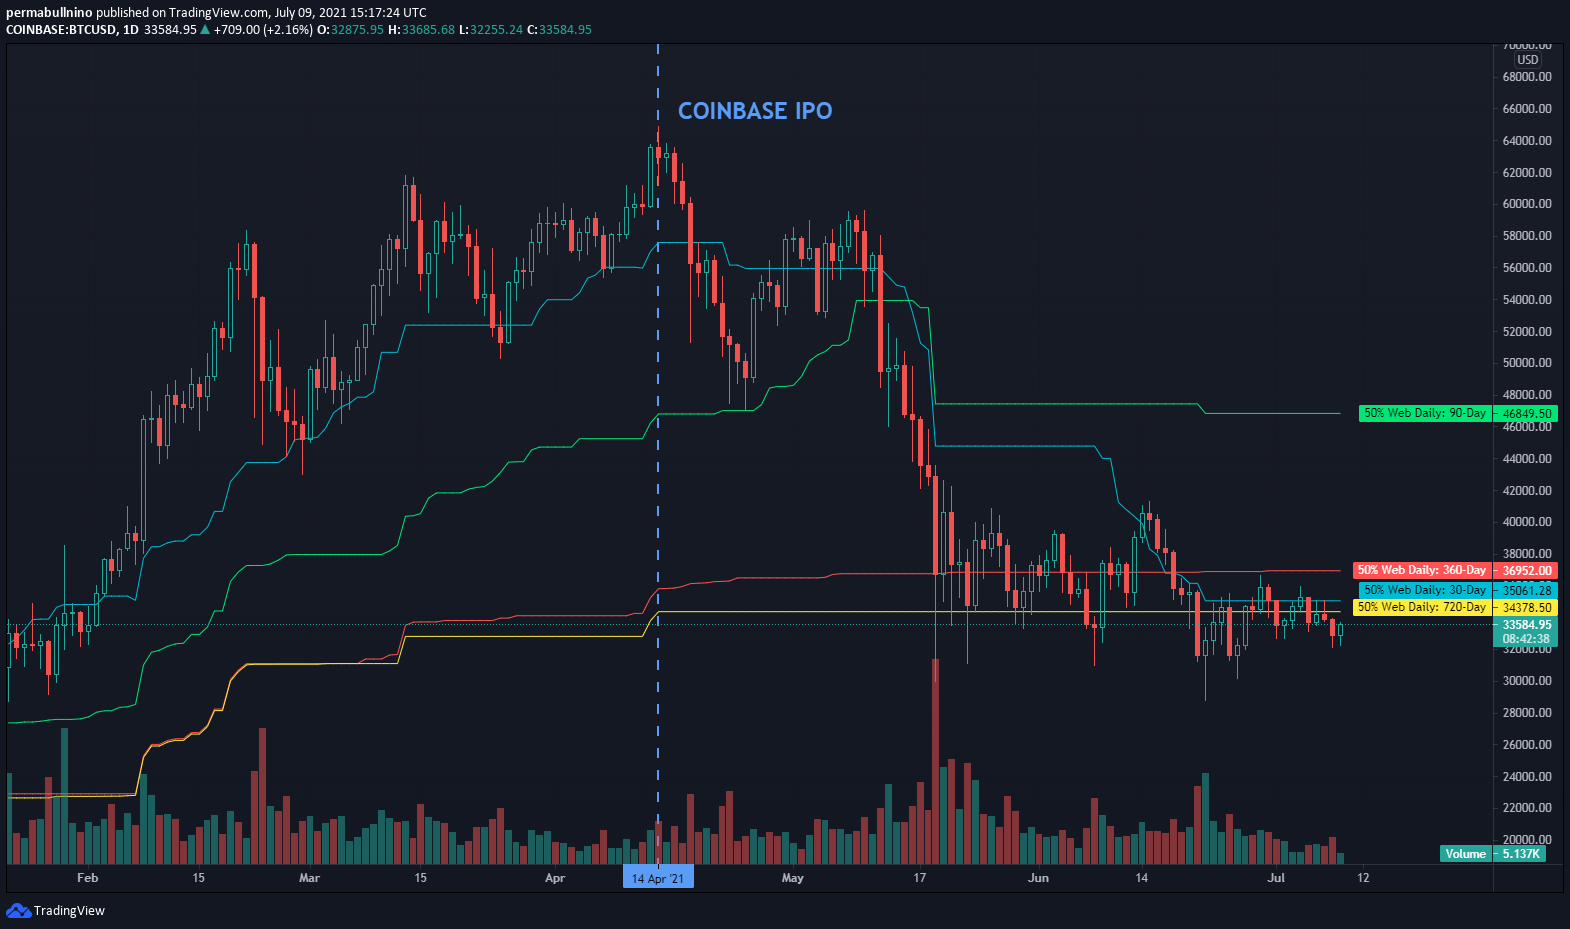
The IPO was the ultimate sell the news event
And the price chart reflects this - the absolute top was the day of the IPO
Just like certain levels trade high volume and are considered “points of control”, I consider the Coinbase IPO a POC as a short to midterm point of reference. With this in mind, let’s get into some charts.

I have a general rule to any newly tradable asset - wait a month before even considering touching it. This rule is in place because it gives an opportunity for price action to develop, and a potential chance to identify a more obvious entry.
This strategy played well with the listing of COIN, which nuked out the gate. COIN is currently trading above the 30-Day 50% web, which tells us that it’s closer to the highs than the lows over the past month. My gut tells me bottom is in.

Now let’s compare performances of the big 3 since the IPO - COIN, BTC, & ETH:
COIN: -23%
BTC: -46%
ETH: -7%
Since the IPO ETH holders are around break even, and BTC holders are still down big. Two questions to consider:
Is this a signal of ETH strength, and will thus lead the charge out of the bottom?
Or, will BTC turn on turbo to catch up to ETH’s performance post IPO?
Either way ~$2,300 is a huge level for ETH and worth monitoring for ETHBTC strength / weakness. My hunch is that BTC leads vs ETH, and the reason is that from the “point of control” perspective (i.e. performance since IPO) BTC is cheap relative to ETH.
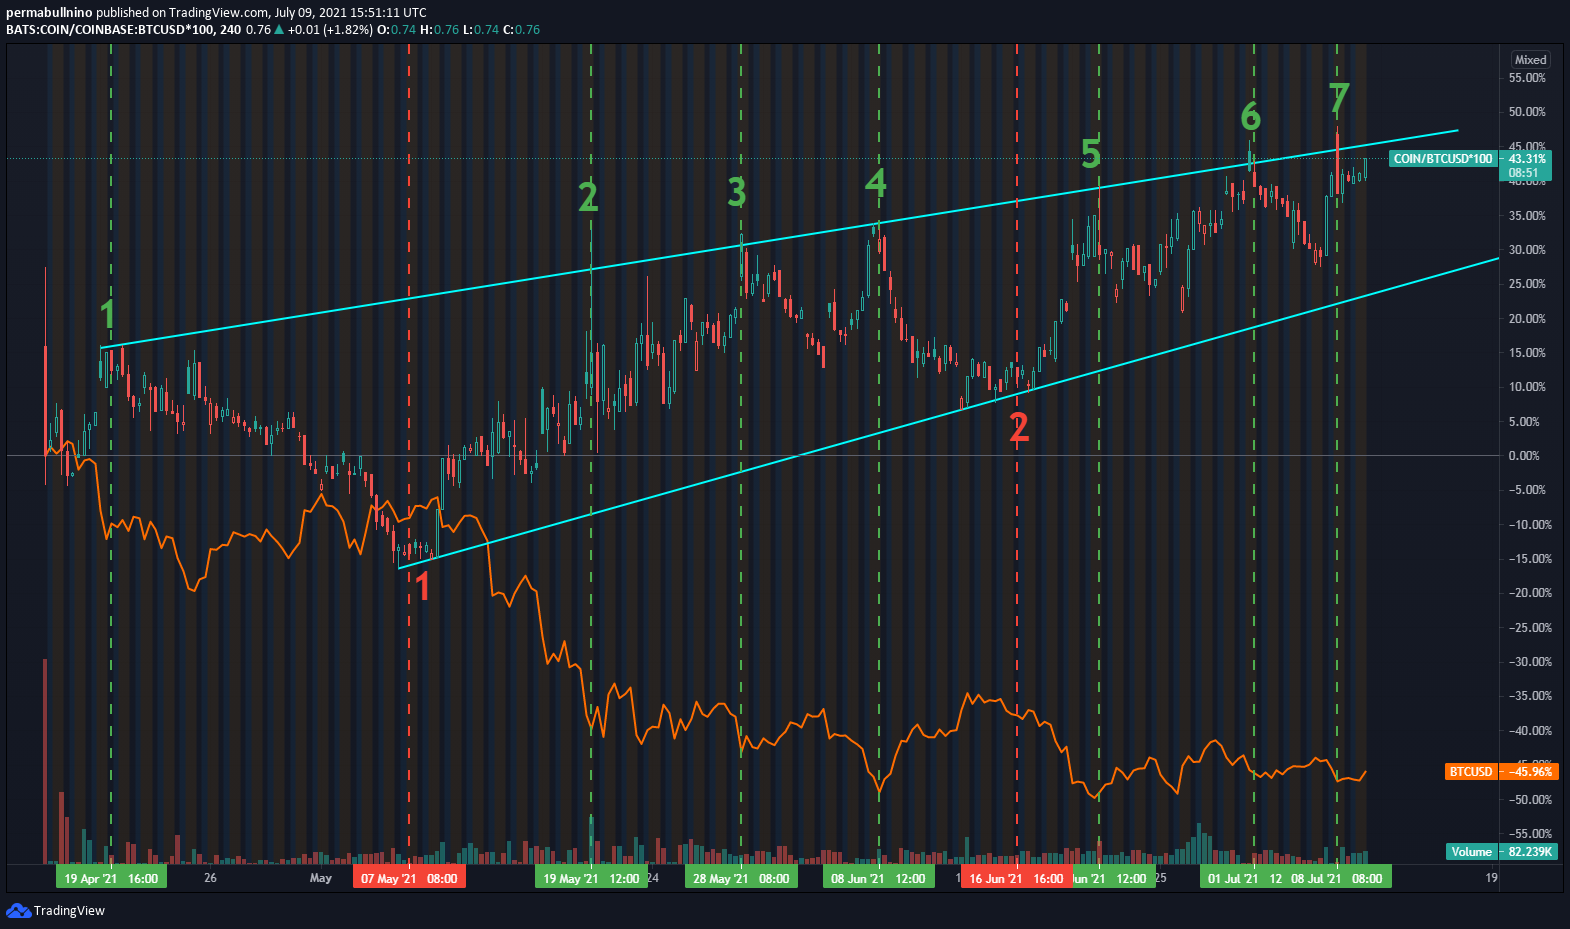
This chart is the most interesting in my opinion. Here’s why:
Hollowed candles show COIN stock price divided by BTCUSD. This is done to compare performance
Orange line is the BTCUSD performance over same period
COIN has outperformed BTC by 43% since IPO
COIN/BTC trading in a wedge
All touches of the top of the wedge have marked BTCUSD bottoms (at least temporary ones)
All touches of the bottom have marked significant tops
Breakdown = bullish BTC
Breakup = bearish BTC
If we’re still in a bull market there is no circumstance where COIN should outperform BTC, the real coin. This chart also shows what I’ve speculated on for a bit - COIN and BTC have been traded as a pair in some capacity, or that one is being used as a proxy for the other.
So, if COIN is bottoming and it’s clear that the two are being traded as a directional pair - has to make me bullish BTC.
If you find any flaws in this brain dump feel free to hit me on Twitter. But thought y’all would find this interesting.
Happy weekend dudes - stay bullish.