

Thinking Out Loud #3: Stablecoin Dive
Thinking Out Loud #3: Stablecoin Dive
"Brr?"

All charts are from or will soon be coming to checkonchain.com
Markets continue in crab mode, so figured today’s post would be a good opportunity to do a brief dive into the stablecoin market. I wanna be able to fit this into Substack’s character limit for email, so will try to keep everything to the point. Let’s dive in.

The stablecoin market cap (excluding DAI) is currently $98 Billion. A year ago today it was around $11-$12 Billion. Insane growth.
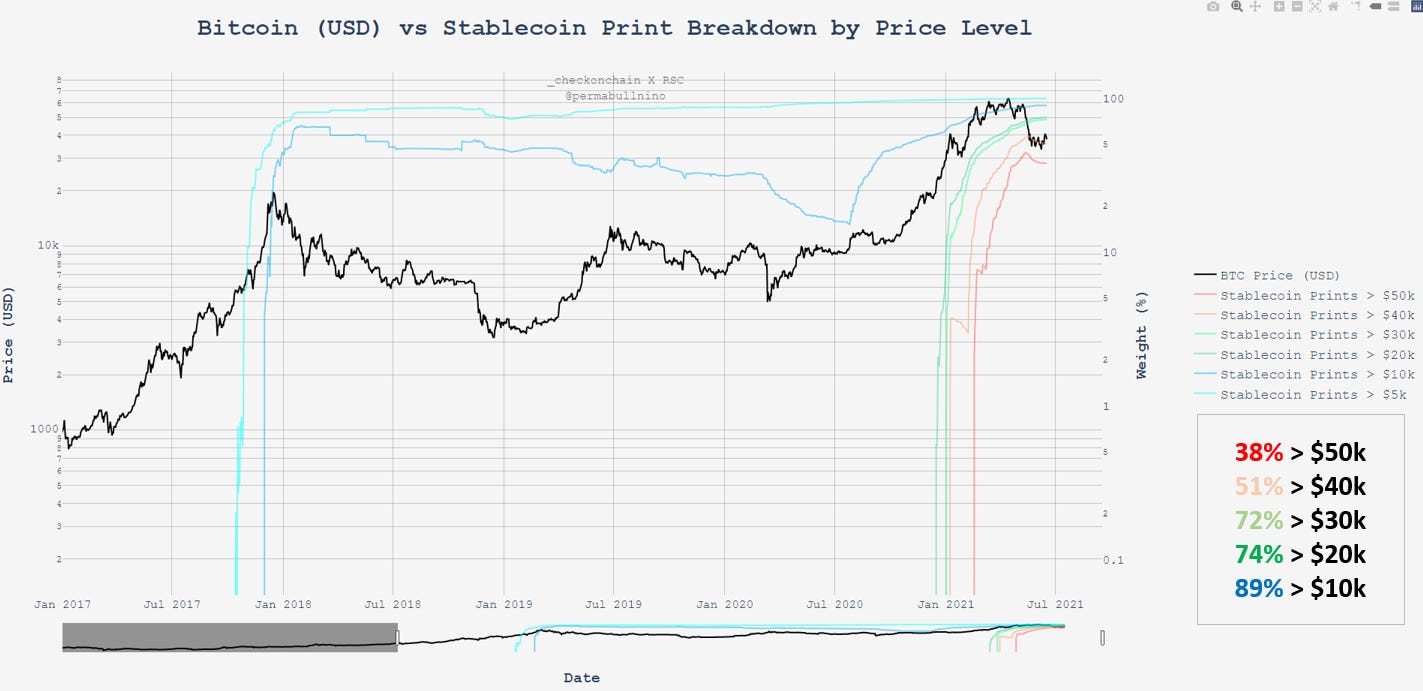
This chart shows stablecoin prints by price levels. If you use this as a gauge for where new money entered the market, you can see that there’s been a large bulk of capital flows above $30k. If we follow this logic, you could reach a guesstimate that ~51% of new money is underwater. Yikes.
Now I want share charts for:
Total Stablecoin Prints
USDT Prints
USDC Prints
BUSD Prints
DAI Prints
I feel like people hear a good bit about the prints, but don’t have a chance to see the charts next to each other often. It’s an interesting exercise because their printing patterns vary.
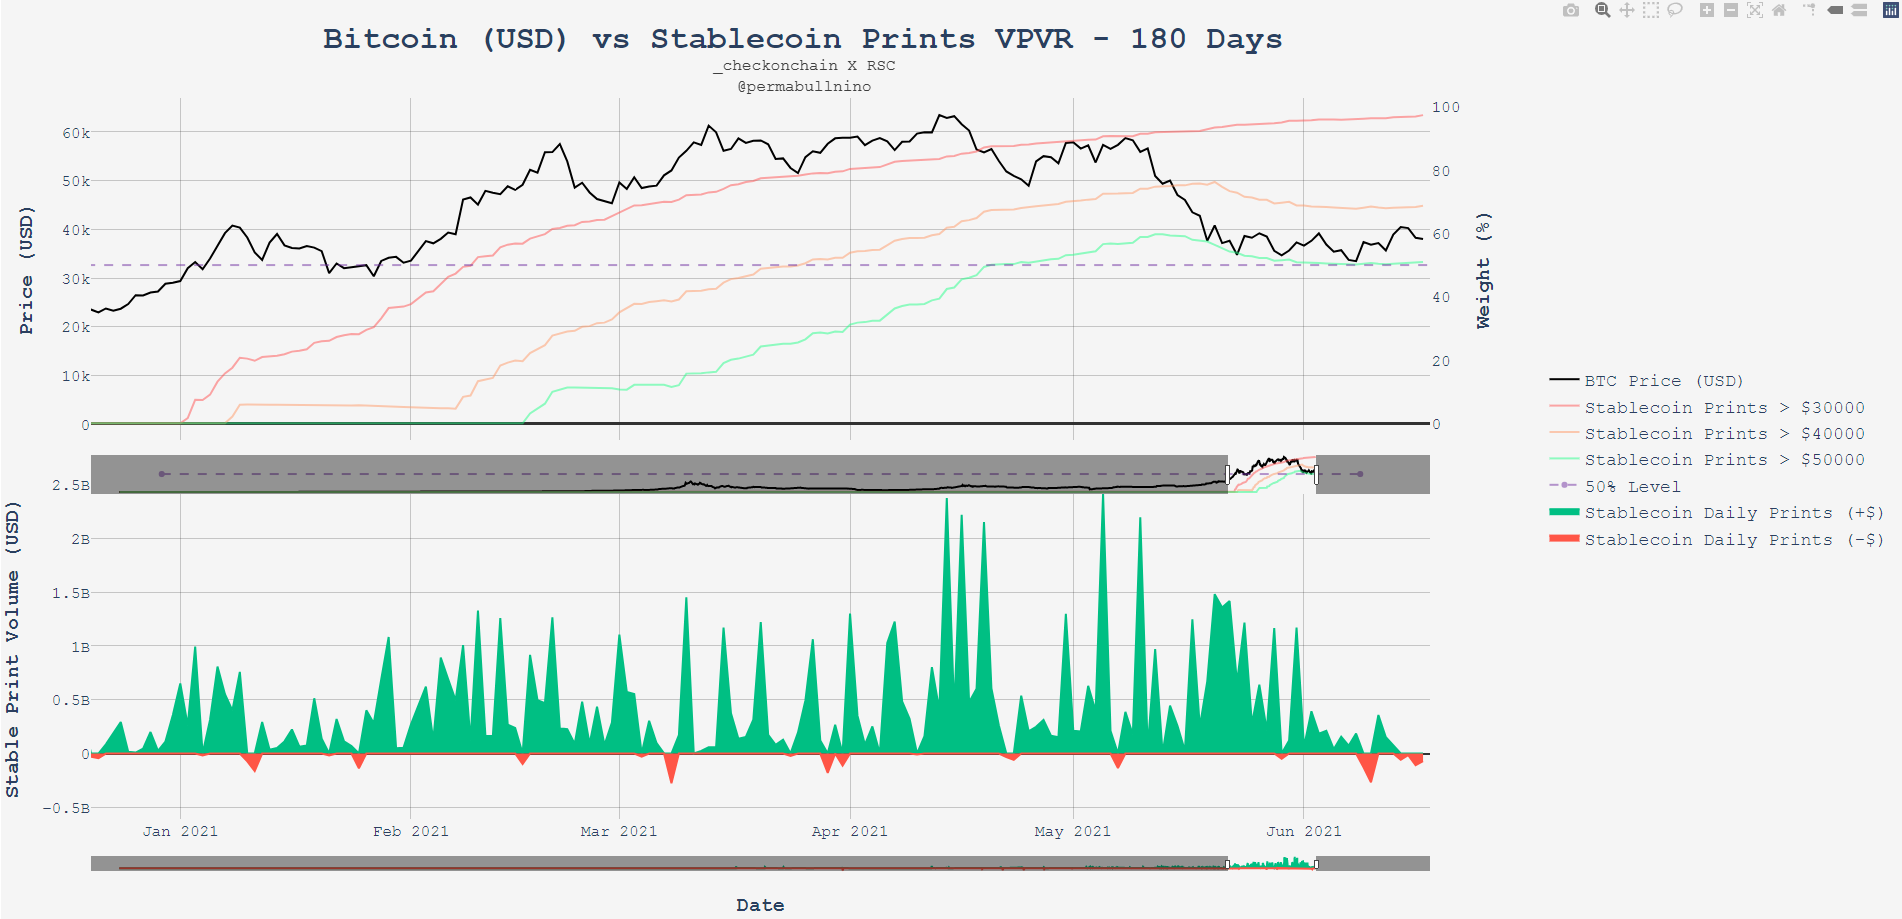
I’d noticed total stablecoin prints had gone relatively flat recently, and this caught my attention. Admittedly - it’s what triggered me to doing this post. To be fair - the week we landed into this range we had the largest weekly total stablecoin print ever at $5 Billion over 7 days. Might just be in need of recharging.
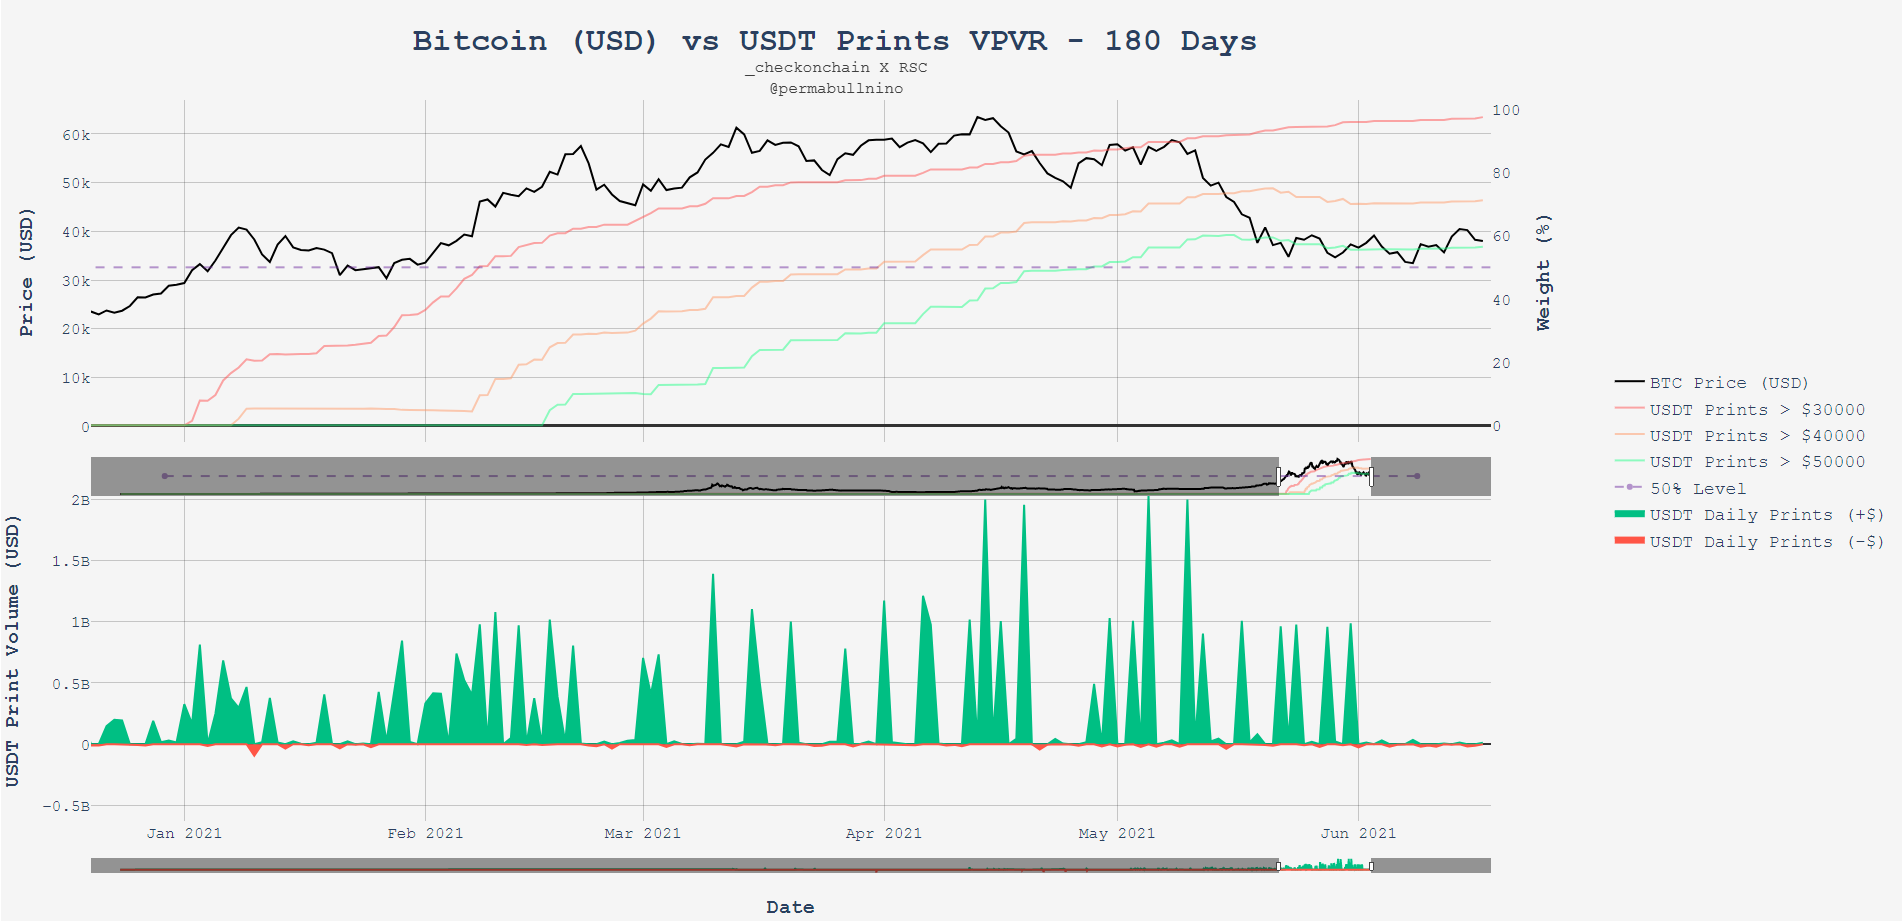
USDT prints are all or nothing. Print sizes average around $1 Billion. Also - as you can see, USDT prints have been on summer vacation for 3 weeks now. Interesting situation with us 50% off the highs.

USDC on the other hand is more green and consistent. Print sizes average between $100 - $300 Million. USDC Dominance has increased since the price dump, which has historically been bullish. Largest print ever on May 21 at $1 Billion, with price at $37k. Also worth noting that the largest flurry of USDC redemeptions were leading into the Coinbase IPO.
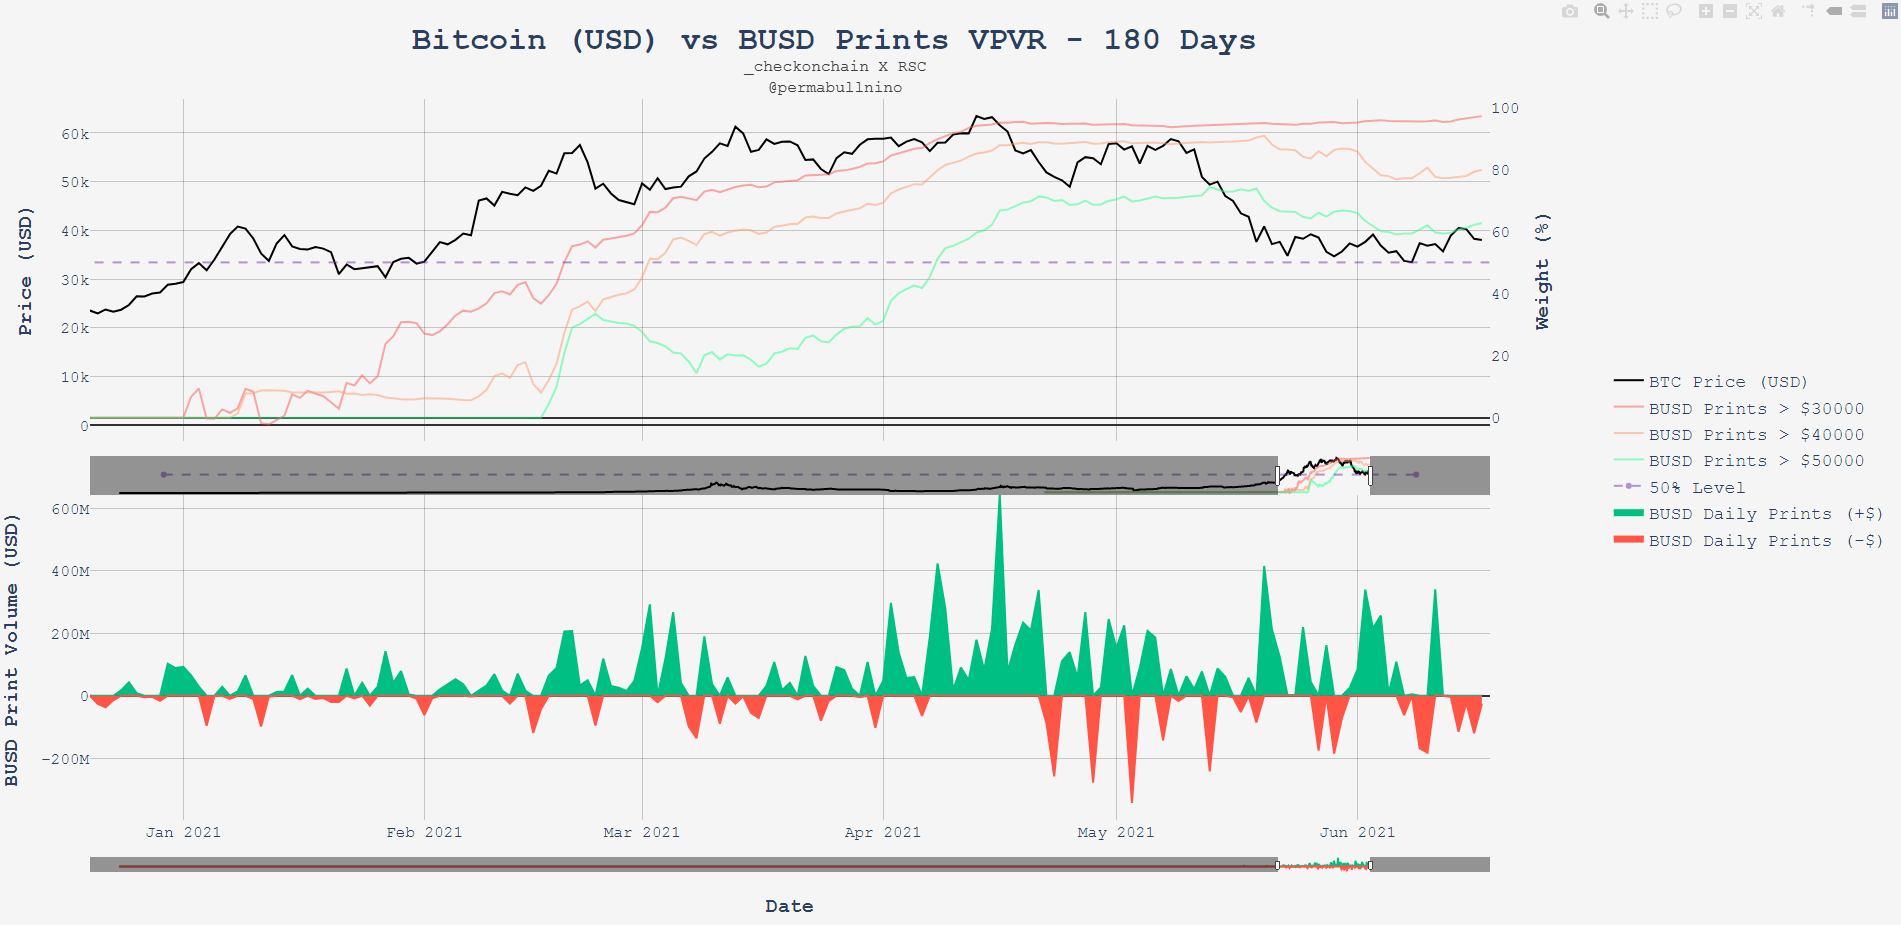
BUSD on the other hand is much choppier in terms of prints and redemptions. A lot of redemptions since late April. Exchange-issued USD for the win!
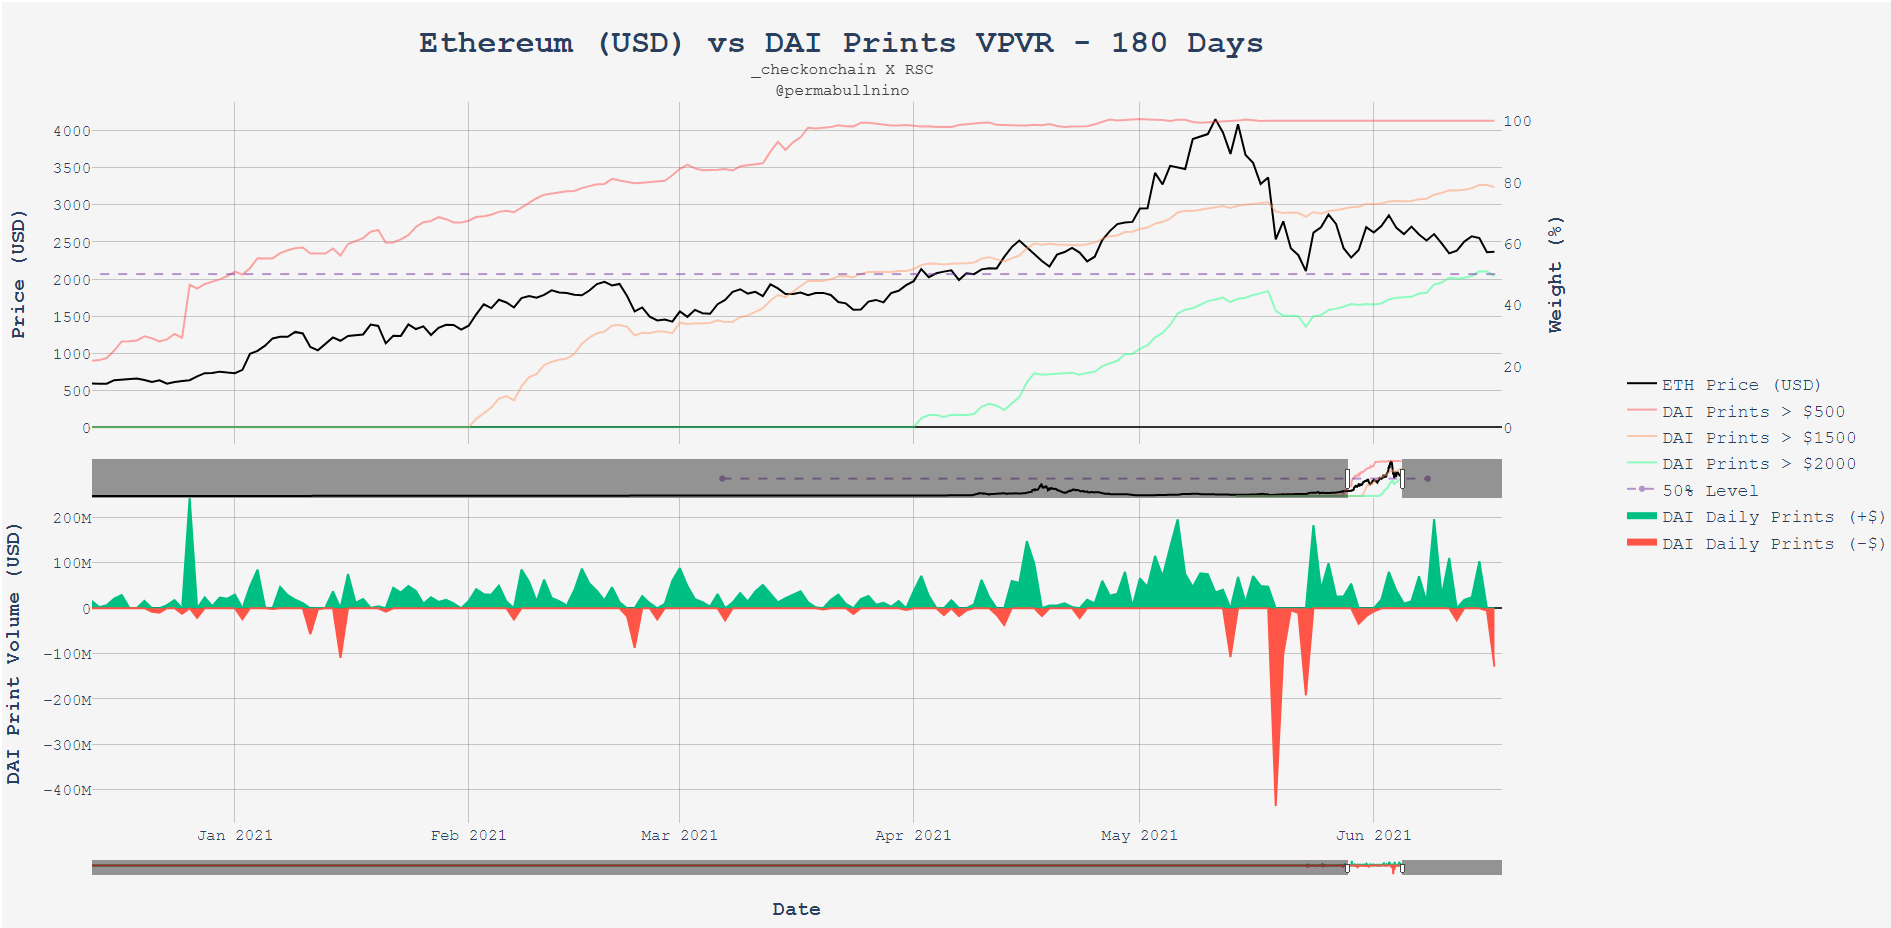
DAI is a rollercoaster of emotion. Largest daily print was December 26, 2020 at $240 Million. I spell out the date because this was the absolute ETHBTC bottom since it’s not plotted above. ETHUSD price on this date was $635.
You can also see that a hefty amount of DAI printing took place through the late April / early May parabolic rise. This ultimately ended in tears, with the largest DAI redemption ever of $435 Million on May 19 (the day of the large BTCUSD downwick). I feel like there’s more that can be done with DAI data with respect to price action, so will circle back around to this if I find something.
Until then - I sign out.
Stay bullish,